I’ve written previously about moves to reduce my carbon footprint.
I was wondering if it’s possible to get better electricity data… and it turns out it is. With thanks to a post on the Facebook “My Efficient Electric Home” group, it turns out the electricity distributors have a way for you to get half-hourly data from your smartmeter. (Links below)
My distributor is United Energy. Sign-up was pretty easy. It’s got some nice dashboards to look at recent data, and you can request a CSV dump of two years’ worth – which it provides in half-hour blocks.
Half-hourly is a bit much, but crunched it into 7-day daily averages below. This shows July 2020 to July 2022, and I’ve tried to match it up with what might have affected usage.
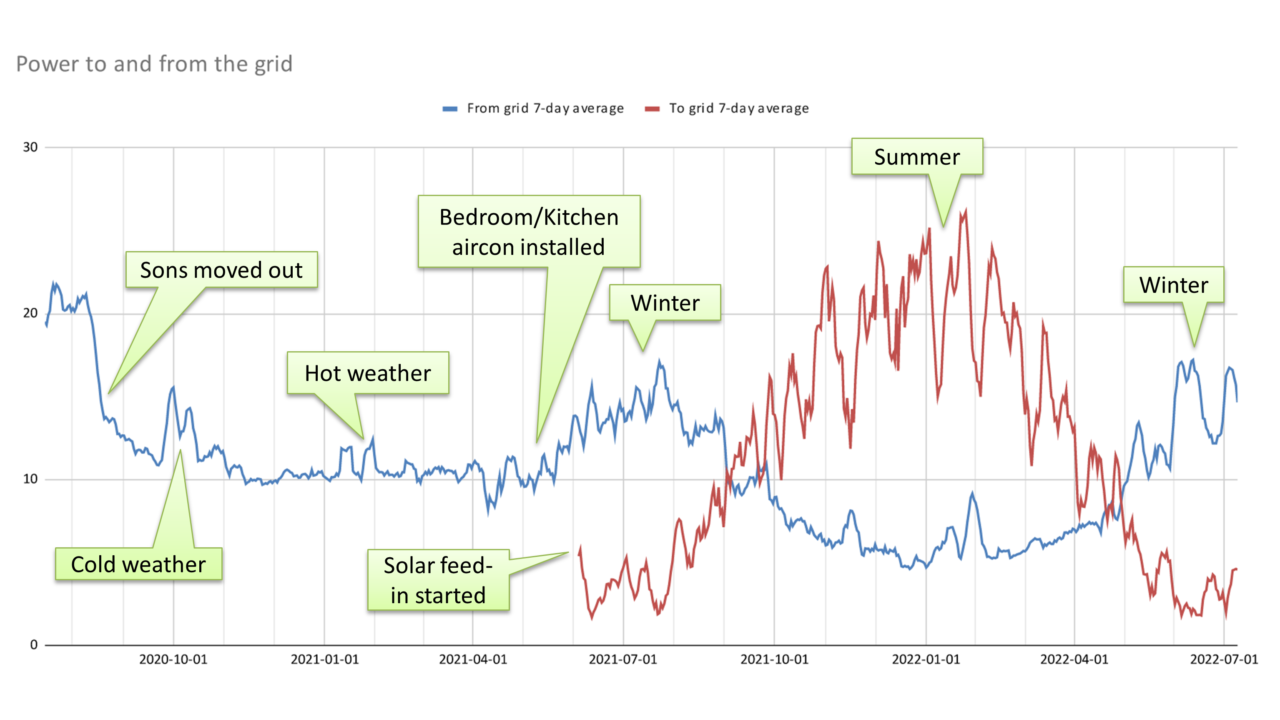
There was a big drop in power usage when my sons moved out in August 2020. From then to the following winter, my usage was about 10 kWh per day when not using (or lightly using) heating/cooling.
Prior to May 2021, I had reverse cycle heating/cooling in the livingroom, but not elsewhere. That month I had more units installed, covering the kitchen and bedrooms, replacing old gas central heating. This has caused my gas usage to drop right off, and my electricity use to increase in winter. That’s good, because gas is not renewable (no matter what the gas industry claims) whereas electricity can be.
Most of the spikes in electricity usage shown above seem to match up to hot and cold weather – this can be seen in the BOM observation data – for instance a run of cold weather in late September and October 2020, and some very hot days in mid and late January 2021.
In mid-2021 I had PV solar installed. This has helped reduce the power used from the grid, particularly in summer.
Getting it down to zero during this time would require a battery so energy generated during the day could be used at night. That’s expensive to do at present, but hopefully the prices will come down over time.
From the looks of these numbers, getting my new usage down to winter could be more challenging.
It’s all quite interesting. If you’re in Victoria and fancy checking your own power usage, check the sites below for your distributor.


